Child BMI Percentile Calculator
This child BMI percentile calculator compares a child's body mass index with the WHO 2007 growth reference for school-age children and adolescents. Enter the child's sex, age, height and weight to get the BMI, the BMI-for-age z-score, the percentile, and the weight-status band. It works in metric or imperial units.
What your child BMI percentile calculator result means
The calculator reports four numbers: the body mass index (BMI), the BMI-for-age z-score, the BMI percentile, and the weight-status band. The BMI is weight in kilograms divided by height in metres squared. On its own, that number means little in a child, because a BMI of 17 is typical for a 7-year-old but low for a 16-year-old. The percentile fixes this by ranking the child's BMI against children of the same sex and completed months of age in the WHO 2007 reference. A percentile of 70 means the child's BMI is higher than the BMI of 70 out of every 100 same-sex, same-age children in that reference population.
The z-score is the same information on a different scale: it counts how many standard deviations the child's BMI sits above or below the reference median. A z-score of 0 is exactly the median (the 50th percentile); +1 is about the 84th percentile and +2 is about the 97.7th percentile. Clinicians often prefer the z-score because it keeps working sensibly at the extremes, where percentiles bunch up near 0 or 100.
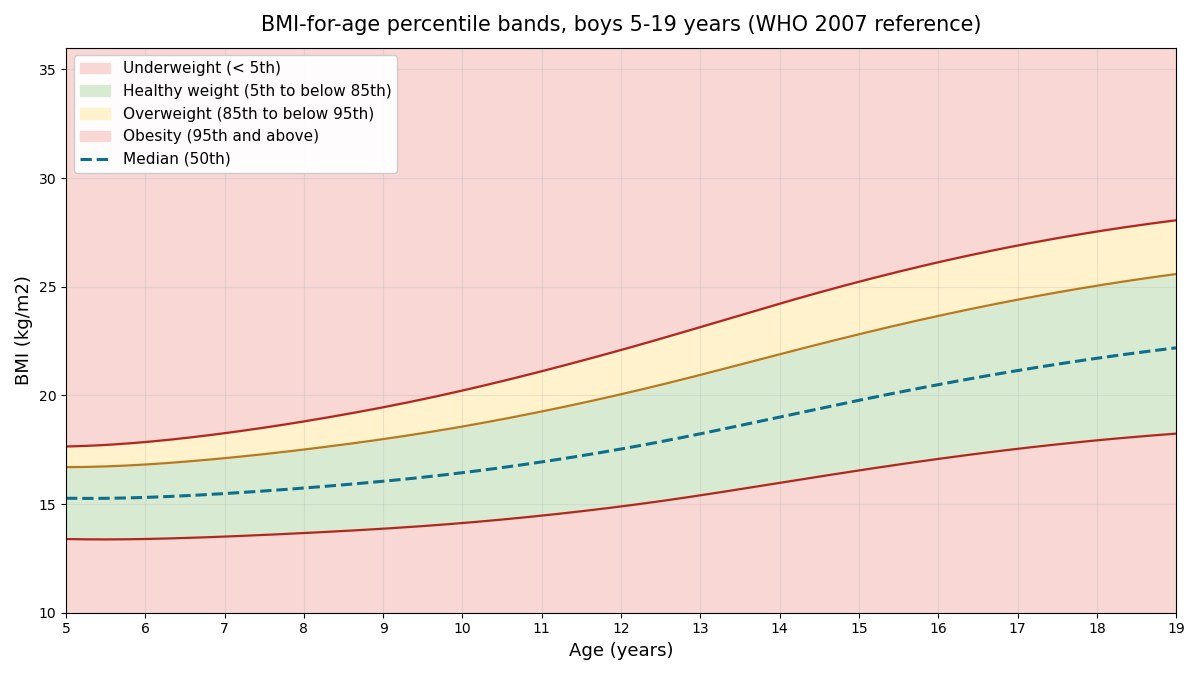
The weight-status band comes from the standard percentile cutoffs used with BMI-for-age, the same bands the CDC uses for children and adolescents:
| BMI-for-age percentile | Weight status | What it signals |
|---|---|---|
| Below the 5th percentile | Underweight | Lower BMI than 95 percent of peers; worth discussing with a clinician, especially if the trend is falling. |
| 5th to below the 85th percentile | Healthy weight | BMI in the middle range for age and sex; keep tracking at routine check-ups. |
| 85th to below the 95th percentile | Overweight | Higher than 85 percent of peers; a prompt to review diet, activity and growth trends. |
| 95th percentile or above | Obesity | At or above the top 5 percent for age and sex; deserves a clinical assessment, not a diagnosis on its own. |
These bands are screening thresholds, not diagnoses. A child who sits just above the 85th percentile is not automatically less healthy than one just below it; the boundaries are statistical conveniences. What matters most is the pattern over time: a percentile that climbs steadily across check-ups tells a different story from one that has always sat near the same line.
How this child BMI percentile calculator computes its result
The calculation follows the same method as the WHO anthroplus software. First, the BMI is computed from height and weight. Then the calculator looks up the LMS parameters for the child's sex and completed months of age in the WHO 2007 BMI-for-age reference tables. L is the Box-Cox power that corrects the skew of BMI at that age, M is the median BMI, and S is the spread. The z-score is then computed with the LMS formula: z equals ((BMI divided by M) raised to the power L, minus 1), divided by (L times S). Finally, the percentile is the area under the standard normal curve up to that z-score, multiplied by 100.
The reference tables are stored in this page at monthly resolution from 60 to 228 completed months (5 years 0 months to 19 years 0 months) for both sexes, exactly as published in the WHO 2007 reference data. The calculator uses the row for completed months of age: a child aged 10 years and 3 months is looked up in the 123-month row. Entering age to the nearest completed month keeps the result faithful to the published tables, because interpolation between rows would be an extra assumption the WHO tables do not make.
If the entered age falls outside 5 to 19 years, the calculator refuses to compute and explains why: there is no WHO 2007 BMI-for-age reference row for that age. Children under 5 should be assessed against the WHO Child Growth Standards (2006), which are a different set of tables. If the z-score comes out beyond plus or minus 5, the calculator flags the result as biologically implausible and asks you to recheck the measurements, because such values almost always reflect a data-entry error rather than a real measurement.
Why children need percentiles instead of adult BMI cutoffs
Adult BMI interpretation is simple: 25 and above is overweight, 30 and above is obesity, regardless of age. That works because adult BMI is roughly stable across the adult years. In children it is not. BMI typically falls after infancy to a low point around age 5 or 6, a dip called the adiposity rebound, then rises through childhood and the teenage growth spurt. A BMI of 16 sits near the median for a 6-year-old boy but below the 5th percentile for a 15-year-old boy. Any fixed cutoff would therefore misclassify huge numbers of children at the ages where it does not fit.
Percentiles solve this by making the comparison age-relative. The reference curves themselves rise and fall with age, as the chart above shows, so a child who tracks along the 60th percentile from age 7 to age 14 is holding a steady position relative to peers even though their raw BMI has risen substantially. Clinicians watch the percentile line, not the BMI number: a child crossing percentile lines upward or downward over successive visits is the signal that prompts a closer look, while a stable percentile is reassuring even when the raw BMI has changed.
There is a related reason the calculator asks for sex. Boys and girls follow different growth curves, particularly from puberty onward, when the timing and composition of the growth spurt differ. A BMI that is the 70th percentile for a 13-year-old boy can be a different percentile for a 13-year-old girl. Using sex-specific reference curves, as this child BMI percentile calculator does, keeps the comparison fair.
How to read each weight-status band
Underweight (below the 5th percentile). The child's BMI is lower than that of 95 percent of same-sex, same-age peers. In a growing child this deserves attention rather than alarm: some children are constitutionally lean, but a low or falling percentile can also reflect undernutrition, chronic illness, or an eating problem. If the percentile has dropped across measurements, or if growth in height has also slowed, a clinician should review it.
Healthy weight (5th to below the 85th percentile). The child's BMI sits in the middle range for age and sex. This is the band where most children fall, and a stable position inside it over time is the goal. It does not guarantee perfect health habits, but from a growth-chart perspective there is nothing to act on. Continue the routine measurements at well-child visits, because the value of the chart is in the trend.
Overweight (85th to below the 95th percentile). The child's BMI is higher than that of at least 85 percent of peers. This is a screening flag, not a diagnosis: it is the range where clinicians start asking about diet, activity, sleep and family patterns, and where small, sustainable changes have the best chance of bending the curve. Many children in this band are otherwise healthy, which is exactly why catching the trend early matters.
Obesity (95th percentile or above). The child's BMI is at or above the top 5 percent for age and sex. Guidelines recommend a clinical assessment at this point: a review of growth history, blood pressure, and risk factors, plus supportive, family-based guidance on nutrition and activity. The number alone does not define the child's health, and the emphasis should stay on habits and trends, never on shame or crash dieting, which can harm a growing child.
Limitations of BMI percentile in children
BMI is an indirect measure: it cannot tell muscle from fat. A child who is heavily muscled from sport can land in the overweight band with low body fat, while a child with little muscle can sit in the healthy band with excess fat. The percentile inherits this limitation. It is a screening step that says who deserves a closer look, not a body-composition measurement.
Timing of puberty adds noise. Two 12-year-olds of the same sex can be at very different stages of puberty, and the one further along will often carry a higher BMI percentile temporarily. The reference curves average over this variation, so an early or late developer can look misplaced on the chart for a year or two. Clinicians interpret the percentile alongside pubertal stage, not in isolation.
The reference population is another caveat. The WHO 2007 reference was built to describe how children grow under good conditions, and it is used worldwide, but no single reference captures every population's build perfectly. Small systematic differences between populations exist, which is why the trend for an individual child matters more than the exact percentile on any single day.
Finally, measurement quality limits everything. Height should be measured without shoes, standing straight against a wall or stadiometer, and weight on a calibrated scale in light clothing. A 2 cm error in height changes the BMI of a 10-year-old by roughly half a point, which can shift the percentile by several points. If a result surprises you, re-measure before acting on it.
When to talk to a clinician
Bring the result to your child's doctor or nurse if the percentile falls outside the healthy range and stays there, if it has crossed two or more percentile lines since the last measurement, or if you notice related concerns such as slowed height growth, fatigue, or disordered eating behaviours. A single home measurement is a starting point for a conversation, not a verdict.
It is also worth discussing the result if your child has a condition that affects growth or weight, such as a thyroid disorder, asthma treated with regular steroids, or a genetic syndrome, because the standard bands may need clinical interpretation in those cases. Children under 5 are outside this calculator's range entirely and should be assessed with the WHO Child Growth Standards for 0 to 5 years.
What the clinician visit usually involves is reassuringly ordinary: a re-measurement on clinic equipment, a look at the growth history, questions about meals, activity, sleep and screen time, and blood pressure. Only if the picture warrants it do further tests follow. The goal is the same as yours: a child growing steadily along their own healthy path.
Frequently asked questions
What is a child BMI percentile?
A child BMI percentile compares a child's body mass index with the BMI values of children of the same sex and age in the WHO 2007 growth reference. A percentile of 70 means the child's BMI is higher than the BMI of 70 out of 100 same-sex, same-age children in the reference population. It is a ranking, not a percentage of body fat.
Why does my child need a percentile instead of a BMI number like adults use?
In adults, fixed cutoffs such as 25 for overweight and 30 for obesity work because adult BMI is stable with age. In children, BMI rises and falls with growth, so a fixed cutoff would misclassify children at different ages. Percentiles compare the child with peers of the same sex and age, which is why paediatric guidance uses BMI-for-age percentiles rather than the adult cutoffs.
What percentile is considered overweight or obese in children?
The standard weight-status bands are: below the 5th percentile is underweight, the 5th to below the 85th percentile is healthy weight, the 85th to below the 95th percentile is overweight, and at or above the 95th percentile is obesity. These are the same bands the CDC uses for children and adolescents aged 2 to 20 years.
How accurate is this child BMI percentile calculator?
The calculator uses the official WHO 2007 BMI-for-age LMS parameters at monthly resolution for ages 5 to 19 years, the same parameters used by the WHO anthroplus software. It computes the z-score with the LMS formula and converts it to a percentile with the standard normal distribution. Results match the WHO reference tables when height, weight and age are measured accurately.
Does a high BMI percentile mean my child is unhealthy?
Not necessarily. BMI percentile is a screening tool, not a diagnosis. A muscular child can have a high BMI percentile with low body fat, and a percentile in the overweight range does not by itself mean a child has a health problem. What matters is the trend over time and the clinical picture, which is why a persistent result outside the healthy range should be reviewed with a clinician.
Which growth reference does this calculator use, and what ages does it cover?
This calculator uses the WHO 2007 growth reference for school-age children and adolescents (de Onis et al., Bulletin of the World Health Organization 2007), which covers ages 5 to 19 years. For children under 5, the WHO Child Growth Standards (2006) are the appropriate reference, so this tool asks for an age between 5 and 19 years.
Related child growth calculators
Sources: de Onis M et al. Development of a WHO growth reference for school-aged children and adolescents. Bull World Health Organ. 2007;85(9):660-667. LMS reference data: World Health Organization anthroplus package, file bfawho2007.txt (BMI-for-age, 5 to 19 years, monthly LMS parameters), matching the WHO 2007 published tables. Percentile cutoffs: standard weight-status bands for BMI-for-age percentiles (underweight below 5th, healthy 5th to below 85th, overweight 85th to below 95th, obesity 95th and above).