Height-for-Age Centile Calculator
This height-for-age centile calculator places your child on the WHO Child Growth Standards for ages 0 to 5 years. Enter sex, age, and the measured height or length for an instant centile, z-score, and plain-language interpretation.
What your height-for-age centile result means
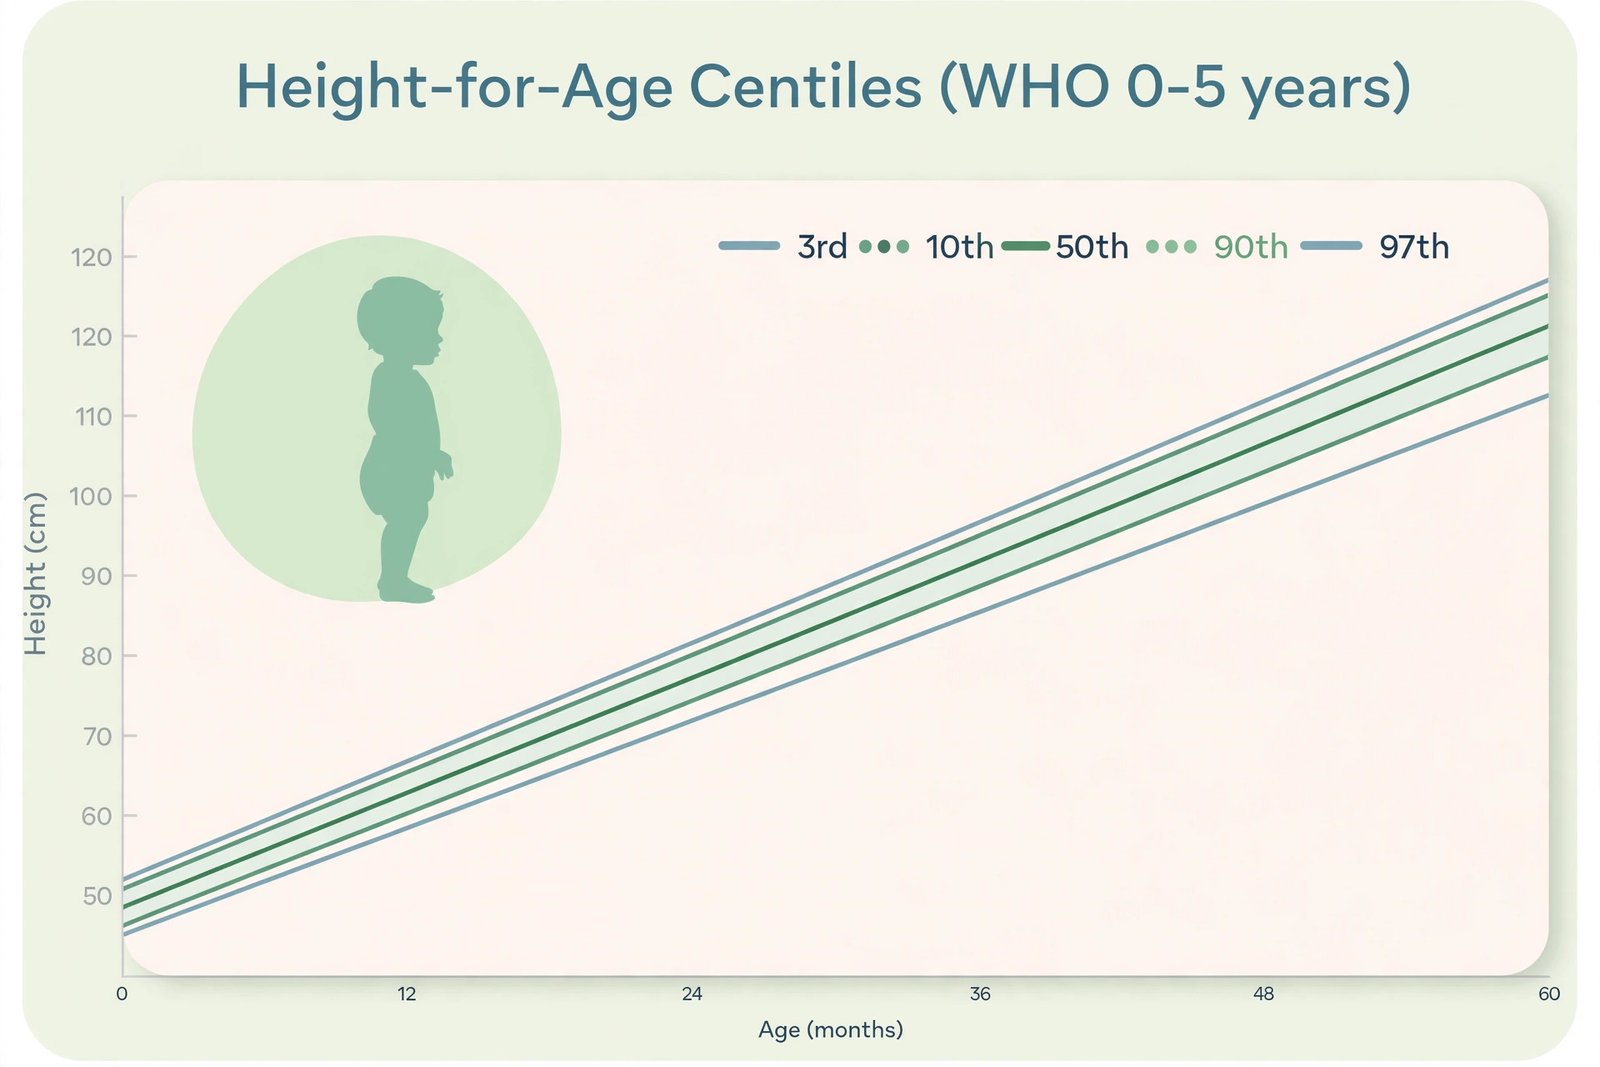
A centile compares your child with 100 healthy children of the same age and sex from the WHO reference population. A child on the 40th centile is taller than 40 of those 100 children and shorter than 60. The middle of the range, around the 50th centile, is simply the average; anywhere between the 3rd and 97th centiles sits within the normal range.
| Centile (z-score) | Interpretation | What to do |
|---|---|---|
| 3rd to 97th (z -2 to +2) | Normal range | Healthy growth. Keep measuring at routine checks. |
| Below 3rd (z below -2) | Short for age (stunting) | Ask your paediatrician to review growth, diet, and health. |
| Below 0.1st (z below -3) | Severely short for age | Needs prompt paediatric assessment. |
| Above 99.9th (z above +3) | Very tall for age | Mention it at the next check-up. |
The trend matters more than any single reading: a child steadily following one centile line is growing normally even far from the 50th, while a child dropping across two centile bands deserves a review even inside the normal range.
How the height-for-age centile is calculated
The WHO Child Growth Standards come from the Multicentre Growth Reference Study (1997-2003), which followed about 8,440 healthy, breastfed children in Brazil, Ghana, India, Norway, Oman, and the United States. The standards describe how children should grow, not just how they do grow.
This calculator uses the official WHO LMS parameters for length/height-for-age. For each month of age the WHO publishes an M (median) and S (spread); the z-score is (measurement / M - 1) / S, and the centile is the matching point on the normal distribution. Under 2 years the tables are in lying length; from 2 years they are in standing height. Because standing measurements run about 0.7 cm shorter, the calculator adds 0.7 cm to a standing measurement under 2 years and subtracts 0.7 cm from a lying measurement at 2 years or older, exactly as the WHO software does.
Measuring your child accurately
- Under 2 years: lay the baby flat on a firm surface, head against a fixed board, legs gently straightened, and measure to the heels.
- 2 years and over: stand the child barefoot against a wall, heels together, back straight, head level, looking straight ahead.
- Measure twice and use the average. A 1 cm wobble can shift the centile noticeably in a small child.
- Always remeasure before acting on an unexpected result; most surprises are measurement slips.
What stunting means and why it matters
When a child's height-for-age falls below the 3rd centile (a z-score below -2), clinicians call it stunting. It is the classic sign of chronic undernutrition: not one missed meal, but months or years of inadequate nutrition, repeated infections, or both, during the period when the body and brain are growing fastest. Globally, stunting is one of the most common forms of child malnutrition, and the World Health Organization tracks it as a headline indicator of child health.
The first 1,000 days, from conception to the second birthday, are the critical window. Growth faltering that happens in this period is the hardest to reverse later, and it is linked not only to shorter adult height but to weaker cognitive development and school performance. That is why paediatricians take a low height-for-age reading seriously even in a child who looks well: it can be the earliest visible clue to a problem with diet, absorption, or chronic illness. The response is never panic over one number; it is a careful review of feeding, illness history, and growth over time, followed by targeted action on whatever is found.
Centiles versus z-scores
This calculator shows both a centile and a z-score, and they describe the same position in two ways. The z-score counts standard deviations from the WHO median: a z-score of 0 is exactly average, -1 is one standard deviation below, and so on. The centile translates that position into "out of 100 children": a z-score of -2 sits at about the 2.3rd centile, and -3 at about the 0.1st.
Clinicians often prefer z-scores for tracking because centiles compress at the extremes. A child moving from a z-score of -2.5 to -3.5 has deteriorated substantially, but on the centile scale that looks like a tiny shift from roughly the 0.6th to the 0.02nd centile, which is easy to misread as no change. For day-to-day understanding, centiles are more intuitive; for following a child over time, the z-score tells the truer story.
Limitations
- These standards cover birth to 5 years. For ages 5 to 19 the WHO publishes a separate 2007 growth reference; ask your paediatrician for those charts.
- A centile describes one moment. Growth velocity, the rate of growth over months, is the more sensitive sign of a problem.
- Premature babies need their age corrected for prematurity until at least 2 years; use corrected age in this calculator.
- This tool does not diagnose growth disorders and does not replace professional assessment.
Frequently asked questions
What is a height-for-age centile?
A height-for-age centile compares your child's height with the WHO reference population of healthy children of the same age and sex. A child on the 40th centile is taller than 40 out of 100 same-age children and shorter than 60. It describes where a child sits in the population, not a grade or a pass mark.
Which ages does this height-for-age centile calculator cover?
This calculator covers birth to 5 years (0 to 60 months), using the WHO Child Growth Standards. For children aged 5 to 19, the WHO publishes a separate 2007 growth reference, so ask your paediatrician for those charts.
Why does lying down or standing up matter?
Children under 2 are measured lying down (length) and children 2 and over are measured standing up (height). Standing measurements run about 0.7 cm shorter than lying ones, so the WHO adjusts by 0.7 cm when the measurement position does not match the age. Tell the calculator how you measured for the correct adjustment.
How often should I measure my child's height?
Growth is a trend, not a single number. Health visitors typically measure at routine checks in the first years. Repeating the same measurement months apart and watching the centile line is far more informative than one reading.
When should I see a doctor about my child's height?
See your paediatrician if a measurement falls below the 3rd centile, if your child drops across two centile bands over time, or if growth seems to have stopped. A single low reading should always be confirmed with a careful remeasurement.
My child dropped from the 50th to the 25th centile. Should I worry?
Both readings are inside the normal range, so one drop like this is often just measurement variation or a normal pause before a growth spurt. What matters is the pattern: mention it at the next routine check, and see your paediatrician sooner if the line keeps falling across further visits or growth seems to have stalled.
Is the z-score or the centile more important?
They describe the same thing. Centiles are easier to picture, but z-scores are better for tracking change over time because centiles squash together at the extremes. A move from z -2.5 to z -3.5 is a real deterioration that barely registers on the centile scale, so clinicians watch the z-score.