Height Velocity Calculator
This height velocity calculator turns two dated height measurements into an annualised growth rate for your child. Enter the dates and heights, your child's sex and current age, and the tool computes centimetres grown per year, compares the result with published age and sex norms, and explains in plain language whether the rate sits below, within, or above the expected range.
First measurement
Second measurement
What your height velocity calculator result means
The headline number is your child's annualised height velocity: how many centimetres of height were gained per year between the two measurements. A value of 6.0 cm per year means the child grew at a pace that would add 6 centimetres over a full year. The calculator then compares that number with the expected range for the child's age and sex, drawn from published growth research, and gives one of three plain-language verdicts.
- Within expected range: the velocity falls inside the published normal band for this age and sex, roughly where the middle 95 percent of healthy children sit. Growth is proceeding as expected.
- Below expected: the velocity is slower than the published lower limit. One slow reading is not a diagnosis, but it is the classic early warning sign paediatricians watch for, so confirm the measurements and mention it at the next check.
- Above expected: the velocity is faster than the published upper limit. This most often reflects the pubertal growth spurt or a normal fast phase, and it is rarely a concern on its own.
The result also shows the number of days between your measurements and the expected band it was compared against, so you can see exactly where your child's number landed. Remember that a single velocity reading is a snapshot, not a diagnosis: growth comes in spurts and pauses, and clinicians always interpret the rate alongside the child's overall growth chart, health history, and family pattern.
Expected height velocity by age
Growth is fastest in the first year of life and then slows in a smooth curve until the pubertal spurt. The table below shows the expected bands this calculator uses, each taken from a published source rather than invented. For children aged 5 and over, the band is the mean plus or minus two standard deviations from the age- and sex-specific reference ranges published by Kelly and colleagues in the Journal of Clinical Endocrinology and Metabolism in 2014, based on annual height measurements in US children. For ages 1 to 5, it uses the measured velocities of Botton and colleagues (American Journal of Clinical Nutrition, 2008), annualised to centimetres per year. For the first year of life it uses the standard textbook range taught in paediatrics.
| Age | Expected height velocity | Source |
|---|---|---|
| Birth to 12 months | 23 to 28 cm/year | Textbook range (Cohen, Understanding Growth) |
| 1 year | 9.5 to 19.6 cm/year | Botton et al. 2008, mean plus or minus 2 SD |
| 2 years | 6.7 to 11.9 cm/year | Botton et al. 2008, mean plus or minus 2 SD |
| 3 years | 5.7 to 9.8 cm/year | Botton et al. 2008, mean plus or minus 2 SD |
| 5 years | 5.0 to 8.3 cm/year | Botton et al. 2008, mean plus or minus 2 SD |
| Age | Boys: expected range | Girls: expected range |
|---|---|---|
| 6 years | 4.8 to 8.4 cm/year | 4.8 to 8.3 cm/year |
| 8 years | 4.0 to 7.9 cm/year | 3.9 to 8.1 cm/year |
| 10 years | 3.1 to 7.9 cm/year | 3.4 to 9.1 cm/year |
| 12 years | 2.3 to 10.7 cm/year | 2.5 to 9.8 cm/year |
| 14 years | 2.0 to 11.6 cm/year | 0 to 6.4 cm/year |
| 16 years | 0 to 7.0 cm/year | 0 to 2.7 cm/year |
School-age bands: Kelly A et al., mean plus or minus 2 standard deviations. Between the listed ages the calculator interpolates to the nearest published age cell.
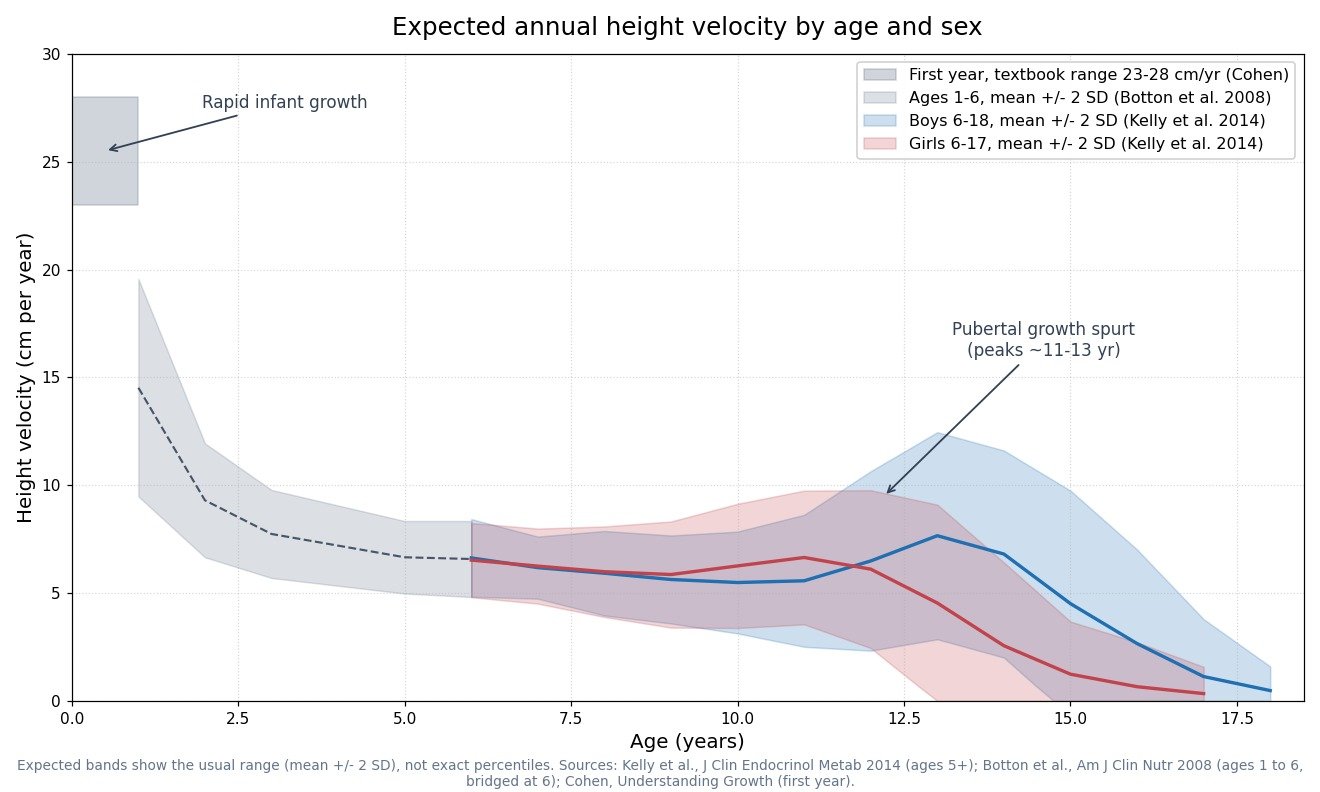
Two things stand out in the chart. First, the pubertal peak arrives earlier and lower in girls (around 11 to 12 years) than in boys (around 13 to 14 years), which is why the calculator asks for sex: the same velocity can be perfectly normal for one sex and unusual for the other at the same age. Second, the bands widen during puberty because children enter their spurts at very different ages, so a wide range is normal there. Note that this tool reports a band comparison, not an exact percentile: the published papers do contain percentile curves, but converting your result to a precise percentile would require reproducing those curves cell by cell, which this calculator does not claim to do. The mean-plus-or-minus-2-SD band is the conventional clinical range for normal and is stated honestly here.
How the height velocity calculator works
The calculation itself is simple division. The tool takes the height gained (second height minus first height), divides it by the exact number of days between the two dates, and multiplies by 365.25 to annualise the result to a full year:
Height velocity = (height 2 - height 1) / (days between / 365.25)
Using 365.25 days per year keeps leap years from skewing the maths. For example, a child measured at 100.0 cm and then at 106.0 cm exactly one year later has a velocity of 6.0 cm per year. A child growing from 90.0 cm to 95.5 cm over six months has gained 5.5 cm in half a year, which annualises to 11.0 cm per year. The entered age is used to select the right expected band; the band that was applied is always shown with your result so the comparison is transparent.
Why short measurement intervals give unreliable results
Every height measurement carries a small error, and the shorter the interval between measurements, the more that error distorts the velocity. This is not a minor technicality: growth researchers Hermanussen and Scheffler summarise it plainly in their 2025 practical guide, writing that height measurements are afflicted with error and that the shorter the time interval between measurements, the greater its relative contribution to the assessment of a growth rate. In the classic study behind that guidance, more than 30 percent of one-month height differences, and still 5 percent of two-month differences, under- or overestimated the true half-yearly growth rate by more than 100 percent. Tanner and colleagues made the same point back in 1966, showing that six-month increments have consistently higher variability than yearly increments.
The arithmetic makes it concrete. A half-centimetre measurement slip spread over three months annualises into a 2 cm per year error; the same half-centimetre slip spread over a full year is only a 0.5 cm per year error. Seasonal effects, minor illnesses, and the natural stop-start rhythm of growth add further noise at short intervals. That is why this calculator flags any interval under three months with a caution, and why paediatricians prefer 6 to 12 months between measurements when they assess growth velocity. If your interval is short, treat the number as a rough sketch and remeasure after more time has passed.
Measuring your child accurately
A trustworthy velocity starts with trustworthy measurements. The paediatric teaching guide by Cohen recommends proper equipment such as a stadiometer rather than improvised wall marks, taking two or three measurements and averaging them, and checking the child's position before each measurement, because posture alone can shift the reading by a centimetre or more.
- Measure without shoes, with heels together, back straight, and head level, looking straight ahead.
- For babies under 2, measure lying down on a firm surface with legs gently straightened; from 2 years, measure standing up.
- Measure at a similar time of day for both readings and use the same equipment and technique each time.
- Record the date of every measurement. A velocity calculated from guessed dates is no better than a guess.
- If a result surprises you, remeasure before doing anything else. Most unexpected numbers are measurement slips, not growth problems.
When a slow growth rate needs a clinician
A below-expected velocity deserves attention but not alarm. Paediatric teaching sets out clear warning signals: between age 3 and puberty, a growth rate below 5 cm per year combined with downward crossing of centile channels on the growth chart after 18 months of age warrants evaluation, while just before puberty the rate may dip to about 4 cm per year and still be normal. Other signals that prompt a review are height below the 3rd percentile and height more than two standard deviations below the mid-parental target height. If you want to check the genetic side, our mid-parental height predictor estimates your child's target range from the parents' heights, and the bone age calculator page explains how skeletal maturity refines the picture.
Context matters enormously. A child who has always grown slowly along a low centile, with short parents and a normal examination, often simply has familial short stature. A child whose velocity has fallen off from its previous pattern, especially with tiredness, chronic illness, poor appetite, or delayed puberty, needs a proper workup. Causes a clinician will consider include thyroid problems, growth hormone deficiency, coeliac disease, chronic kidney or bowel disease, and the effects of long-term steroid medicines. None of these can be diagnosed from a velocity number alone, which is exactly why the number is a prompt for a visit, not a verdict.
Above-expected velocity is usually the least worrying result. Growth is not a smooth conveyor belt; children grow in mini spurts and pauses, and a fast phase often follows a slow one. During puberty, velocity can briefly reach 8 to 12 cm per year. Mention a persistently high velocity at the next routine appointment so it can be seen alongside puberty staging, but on its own it rarely signals disease.
Limitations of this height velocity calculator
- The expected bands come from specific study populations: US children for the school-age reference and French children for the early-childhood reference. Healthy children of other backgrounds follow similar patterns, but the exact limits may differ.
- The tool reports below, within, or above the expected band. It does not compute an exact percentile, and the band edges are guideposts, not diagnostic cutoffs.
- For premature babies, use corrected age (age from the original due date) until at least 2 years of age.
- A single velocity reading cannot diagnose a growth disorder. Clinicians look at the trend across several measurements, the child's centile pattern, puberty stage, and health history.
- This calculator is for information only and does not replace professional assessment. Growth concerns should always be discussed with a paediatrician.
Sources
- Kelly A, Winer KK, Kalkwarf H, et al. Age-based reference ranges for annual height velocity in US children. Journal of Clinical Endocrinology and Metabolism. 2014;99(6):2104-2112. (Expected bands for ages 5 and over: mean plus or minus 2 standard deviations.)
- Botton J, Heude B, Maccario J, Ducimetiere P, Charles MA; FLVS Study Group. Postnatal weight and height growth velocities at different ages between birth and 5 y and body composition in adolescent boys and girls. American Journal of Clinical Nutrition. 2008. Full text at PubMed Central. (Expected bands for ages 1 to 5, annualised from cm/month.)
- Cohen LE. Understanding Growth: Normal vs. Abnormal Patterns. PediCases facilitator guide, Harvard Medical School / Children's Hospital Boston. Facilitator guide (PDF). (Textbook velocity ranges and clinical warning signals.)
- Hermanussen M, Scheffler C. Reference values for short term height velocity: a brief practical guide. Human Biology and Public Health. 2025;2:1-5. doi:10.52905/hbph2025.2.110. (Why short measurement intervals mislead.)
Frequently asked questions
What is height velocity?
Height velocity is the rate at which a child grows taller, expressed in centimetres per year. It is calculated from two height measurements taken on known dates: the height gained divided by the time between the measurements, annualised to a full year. Paediatricians consider it one of the most sensitive signs of healthy or faltering growth, because a change in the rate often shows up before a child drops to a low centile.
Which published reference do the expected bands come from?
For ages 5 and over, the expected band is the mean plus or minus two standard deviations from Kelly et al., Age-based reference ranges for annual height velocity in US children (Journal of Clinical Endocrinology and Metabolism, 2014). For ages 1 to 5 it uses the measured velocities of Botton et al. (American Journal of Clinical Nutrition, 2008), annualised. For the first year of life it uses the textbook range of 23 to 28 cm per year (Cohen, Understanding Growth, Harvard Medical School). The calculator does not compute exact percentiles; it reports whether the result falls below, within, or above the expected band.
Why does the calculator warn when my measurements are less than 3 months apart?
Small measurement errors get amplified when the interval is short. A half-centimetre slip annualised over 3 months becomes a 2 cm per year error, but the same slip over a full year is only 0.5 cm per year. Research on short-term growth (Hermanussen and Scheffler, 2025) shows that more than 30 percent of one-month height differences misjudge the true half-yearly rate by over 100 percent. For a trustworthy velocity, measure 6 to 12 months apart.
What counts as a slow growth rate in a child?
A commonly taught warning signal is a growth rate below 5 cm per year between age 3 and puberty, especially if the child is also crossing downward across centile lines on the growth chart (Cohen, Understanding Growth). Just before puberty the rate can dip to about 4 cm per year and still be normal. A single slow reading should always be confirmed with careful remeasurement before any conclusions are drawn.
My child's height velocity is above expected. Should I worry?
Usually not. An above-expected velocity most often reflects the pubertal growth spurt arriving a little early, or simply a healthy fast-growing phase; growth comes in spurts and pauses rather than a smooth line. Mention it at the next routine check so the clinician can see it in context, and seek advice sooner only if it comes with other concerns such as very early puberty signs.
How is height velocity different from the height-for-age centile?
The height-for-age centile describes where a child stands at one moment compared with peers, while height velocity describes how fast the child is moving. A child can sit on a low but stable centile and still have a perfectly normal velocity, which is reassuring. Conversely, a child on an average centile whose velocity has slowed may be showing the earliest sign of a problem. Clinicians value the velocity because it captures change.