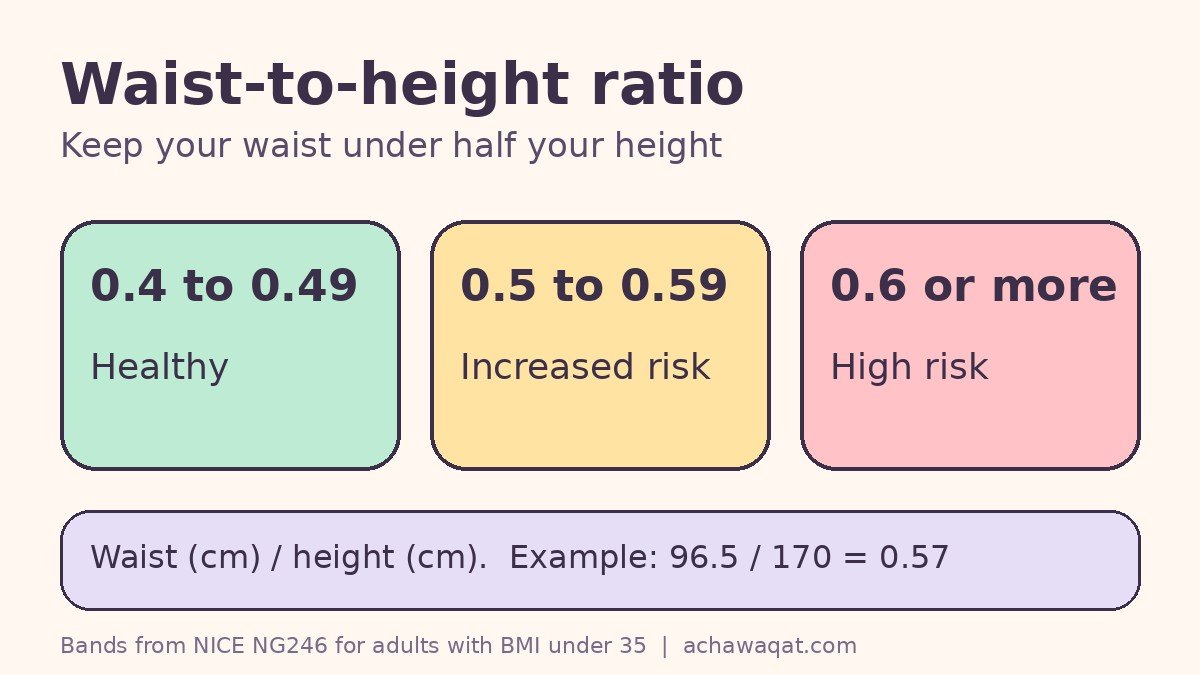
Waist-to-height ratio is your waist measurement divided by your height, using the same units for both. The simple rule from the UK’s National Institute for Health and Care Excellence (NICE) is to keep your waist to less than half your height, which means a ratio under 0.5. BMI tells you about overall weight for your height. Waist-to-height ratio tells you more about fat stored around the middle, which is the kind most linked with type 2 diabetes, high blood pressure and heart disease. So in the waist-to-height ratio vs BMI question, NICE now advises using both numbers together for most adults. You can start with our free BMI calculator, then grab a tape measure.

Key terms in plain words
| Term | What it means |
|---|---|
| BMI (body mass index) | Weight in kilograms divided by height in metres squared. A quick measure of overall weight for height. |
| Waist-to-height ratio (WHtR) | Waist circumference divided by height, both in the same units. A quick estimate of fat around the middle. |
| Central adiposity | Fat stored around the abdomen and organs, rather than spread across the body. |
| Cardiometabolic risk | The combined chance of problems such as type 2 diabetes, high blood pressure and cardiovascular disease. |
What is waist-to-height ratio and how do I measure it?
You only need a tape measure and your height. NICE describes a simple home method:
- Find the bottom of your ribs and the top of your hips.
- Wrap the tape around your waist midway between those two points. For most people this sits just above the belly button.
- Breathe out naturally, then read the tape. Do not suck in.
- Use the same units for waist and height, both in centimetres or both in inches.
- Divide your waist by your height.
Here is the worked example NICE gives. A waist of 96.5 cm and a height of 170 cm gives 96.5 divided by 170, which is 0.57. In inches, 38 divided by 67 gives the same 0.57.
What is a healthy waist-to-height ratio?
NICE classifies central adiposity in adults like this:
| Waist-to-height ratio | NICE category | What it suggests |
|---|---|---|
| 0.4 to 0.49 | Healthy central adiposity | No increased health risk from waist size |
| 0.5 to 0.59 | Increased central adiposity | Increased health risk |
| 0.6 or more | High central adiposity | Further increased health risk |
NICE says these bands can be used for adults with a BMI under 35, for both sexes and all ethnic backgrounds, including people with a lot of muscle. That is one of the nicest things about this measure. You do not need a different chart for men and women.
Waist-to-height ratio vs BMI: which tells you more?
They answer different questions, so the honest answer is that you get the clearest picture from both.
- BMI is quick and useful for overall weight. NICE still calls it a practical measure of overweight and obesity. But it cannot tell muscle from fat, and it says nothing about where fat sits.
- Waist-to-height ratio looks at the middle. Two people with the same BMI can carry weight very differently, and the one with more abdominal fat usually has the higher cardiometabolic risk.
This is why NICE advises measuring waist-to-height ratio as well as BMI in adults with a BMI below 35, and using both to help assess risks such as type 2 diabetes, high blood pressure and heart disease. NICE also points out that a person in the healthy BMI range may still carry central fat, so a “normal” BMI is not the whole story.
If you want the deeper dive on each measure, read our guides to waist-to-height ratio calculation and interpretation and the BMI formula, categories and limitations.
For reference, the adult BMI bands used by NICE and the World Health Organization are:
| BMI (kg/m²) | Category |
|---|---|
| 18.5 to 24.9 | Healthy weight |
| 25 to 29.9 | Overweight |
| 30 to 34.9 | Obesity class 1 |
| 35 to 39.9 | Obesity class 2 |
| 40 or more | Obesity class 3 |
Check your number with the BMI and body surface area calculator if you also want body surface area for clinical use.
Why are BMI cut-offs lower for South Asian and some other backgrounds?
NICE notes that people with a South Asian, Chinese, other Asian, Middle Eastern, Black African or African-Caribbean background are more prone to central fat, and their cardiometabolic risk starts at a lower BMI. For these groups NICE uses lower BMI thresholds: overweight from 23 to 27.4, and obesity from 27.5 upward. That matters a lot for readers from Pakistan, India, Bangladesh and the wider diaspora. A BMI of 25 might look fine on a standard chart and still be in the overweight range for you.
The waist-to-height ratio bands stay the same for every background, which makes it a handy cross-check.
When should BMI be read with extra caution?
- High muscle mass. Athletes and people who lift can have a high BMI without much body fat. NICE says to interpret BMI with caution here.
- Age 65 and over. NICE advises caution, taking health conditions and function into account, and noting that a slightly higher BMI may be protective in older age.
- BMI of 35 or more. NICE’s waist-to-height advice is aimed at adults with a BMI below 35, because at that level central fat is usually already high.
- Pregnancy and children. Adult cut-offs do not apply. For pregnancy, see our pregnancy weight gain tracker. Children need age-specific charts.
My ratio is 0.5 or higher. What should I do next?
Do not panic. A ratio of 0.5 or more is a signal to look closer, not a diagnosis. NICE suggests that people whose measurement shows increased risk seek advice from a health professional, who may check things like blood pressure, blood sugar and cholesterol.
Two of our tools can help you prepare for that conversation:
- The FINDRISC diabetes risk score uses waist size, BMI, age, activity and family history to estimate your 10-year chance of type 2 diabetes.
- The ASCVD risk calculator estimates 10-year heart attack and stroke risk once you know your blood pressure and cholesterol.
If you re-measure, do it the same way each time, at the same spot and after breathing out, so you compare like with like.
Frequently asked questions
Is a waist-to-height ratio of 0.5 bad?
Under NICE’s bands, 0.5 to 0.59 means increased central adiposity and increased health risk. It is a reason to talk with a clinician and check other risk factors, not a diagnosis of disease.
Is waist-to-height ratio better than BMI?
It adds information that BMI misses, mainly where fat is stored. NICE recommends using both together in adults with a BMI under 35, rather than replacing one with the other.
Can I use centimetres for waist and inches for height?
No. Both measurements must be in the same unit, or the ratio will be wrong.
Do men and women have different waist-to-height targets?
No. NICE uses the same bands for both sexes and all ethnic backgrounds. The simple target is a waist under half your height.
Where exactly should I measure my waist?
Midway between the bottom of your ribs and the top of your hips, usually just above the belly button, after breathing out normally.
Sources
- NICE NG246: Identifying and assessing overweight, obesity and central adiposity
- World Health Organization: Obesity and overweight fact sheet
This article is for general education and does not replace advice from your own doctor. Calculators on Acha Waqat are aids to understanding, not a diagnosis.
