Phenytoin Level Calculator
This phenytoin level calculator corrects a measured total phenytoin level for low albumin with the Sheiner-Tozer equation, using the normal-renal and end-stage-renal-disease forms, then interprets the adjusted level against the 10 to 20 mg/L therapeutic range. It also estimates a proportional maintenance-dose correction toward a target level and, when weight is given, a loading dose to reach that target. Enter the measured total level and the albumin; the renal function, current dose, target and weight are optional refinements.
What your result means
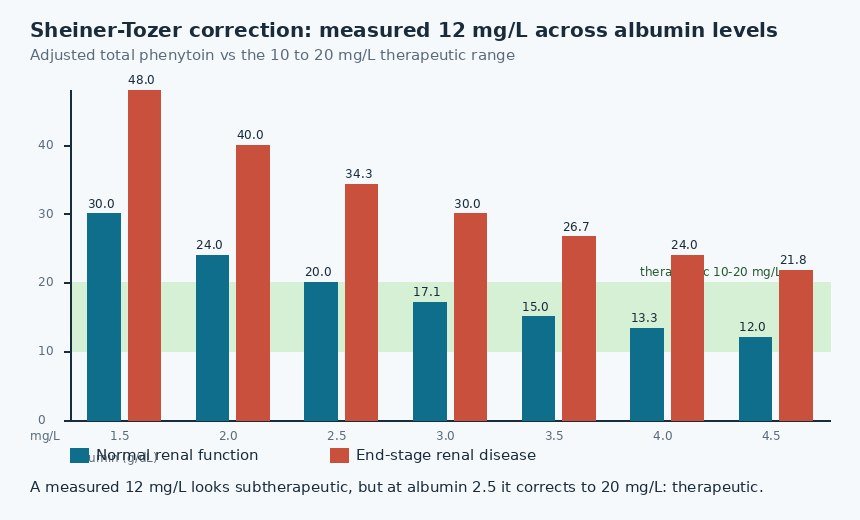
The result panel starts with the Sheiner-Tozer adjusted total level and its interpretation, then shows the optional refinements only when the inputs for them were given. For a measured total level of 12 mg/L with an albumin of 2.5 g/dL and normal renal function, the calculator reports an adjusted level of 20.0 mg/L, which is at the top of the therapeutic range: the measured 12 looks subtherapeutic, but the corrected value says the patient is adequately treated, and raising the dose on the uncorrected number would push into toxicity. For the same measured 12 mg/L with albumin 2.0 g/dL in end-stage renal disease, the adjusted level is 40.0 mg/L, frankly toxic, which is why the ESRD option exists. When a current daily dose and target are given, the panel adds the proportional corrected dose with the non-linearity caution; when weight is given, it adds the loading dose to reach the target from the measured level.
How the phenytoin level calculator works
About 90% of phenytoin in plasma is bound to albumin and only the free 10% is pharmacologically active. Laboratories report the total, bound plus free, which is only a faithful guide to the free fraction when albumin is normal. When albumin falls, the same total level hides a larger free fraction, so the patient can be therapeutic or toxic on a "low" number. The Sheiner-Tozer equation converts the measured total into the level that would be expected at normal albumin, adjusted = measured / (0.2 x albumin + 0.1) with albumin in g/dL. The denominator is the estimated free fraction at that albumin: at albumin 4.0 it is 0.9, so almost no correction, while at albumin 2.0 it is 0.5, roughly doubling the measured value.
In end-stage renal disease a second effect appears: uraemic toxins compete with phenytoin for albumin binding sites, so the free fraction is higher than albumin alone predicts. The equation then uses adjusted = measured / (0.1 x albumin + 0.1). The calculator applies whichever form matches the selected renal function. Both forms are estimates of the free level's equivalent total, not measurements of it; when the estimate will drive a critical decision, a direct free phenytoin level is the tiebreaker.
Why phenytoin levels mislead: binding, displacement and the free fraction
Hypoalbuminaemia is only the commonest of several traps. Drugs that displace phenytoin from albumin, notably valproate, raise the free fraction while the total stays the same or even falls; valproate then also inhibits phenytoin metabolism, so the free level climbs further. The combination can produce toxicity on a measured total that sits comfortably inside 10 to 20 mg/L. Critical illness, pregnancy and the elderly add similar binding changes. The clinical rule is simple: when the patient's picture and the total level disagree, believe the patient and measure free phenytoin.
Timing matters too. A level drawn too soon after a dose change, or not at steady state, reflects the old regimen wearing off, not the new one. Because phenytoin elimination saturates, its half-life lengthens as levels rise: near the top of the range it can exceed 24 hours, so steady state after a dose change may take a week or more. The calculator's dose correction assumes the measured level is a true steady-state trough, usually drawn just before the morning dose.
Dose adjustment: the proportional estimate and the non-linearity warning
The proportional correction, new dose = current dose x (target / measured), is the standard bedside estimate, but it is only an estimate because phenytoin metabolism is saturable. The enzymes that clear it approach their maximum rate within the therapeutic range, so once the level is high, a modest dose increase can send the level soaring. In practice this means two things: dose increases above about 20% should be made with extra caution and a planned recheck, and any corrected dose is a starting point for the next level, not a final answer.
The loading dose estimate uses the volume of distribution, about 0.65 L/kg in adults: loading dose = (target - measured) x 0.65 x weight. Intravenous loading is normally given as fosphenytoin, dosed in phenytoin equivalents (PE), because phenytoin itself is poorly soluble and can only be infused slowly. If the measured level already exceeds the target, no loading dose is shown, since loading would only add toxicity.
Reading the bands: nystagmus, ataxia and the range's limits
| Adjusted total level (mg/L) | Interpretation |
|---|---|
| Below 10 | Subtherapeutic for most patients; breakthrough seizures possible |
| 10 to 20 | Therapeutic range for most patients |
| 20 to 30 | Nystagmus common; early toxicity |
| 30 to 40 | Ataxia and dysarthria typical |
| Above 40 | Depressed consciousness; coma possible |
The classic teaching sequence, nystagmus then ataxia then coma as levels climb, is a useful pattern but not a law. Individual sensitivity varies widely: chronic users may tolerate 25 mg/L without obvious signs, while a frail elderly patient can be unsteady at 18. The range guides dosing; the patient's examination decides whether the level is right for them.
Free phenytoin: when to order it instead
Direct free phenytoin measurement, therapeutic 1 to 2 mg/L, bypasses every correction equation and is the right test when the corrections are shakiest: end-stage renal disease, combined hypoalbuminaemia and interacting drugs, pregnancy, critical illness, and any patient whose clinical state contradicts their total level. It costs more and is not available everywhere, which is why the Sheiner-Tozer estimate remains the workhorse; but for the highest-stakes decisions, the measured free level is worth waiting for.
Limitations of this calculator
- The Sheiner-Tozer correction is an estimate of the free fraction, not a measurement; direct free phenytoin is definitive when available.
- The proportional dose correction is approximate because phenytoin kinetics are non-linear; recheck the level at steady state after every change.
- Drug interactions (valproate, enzyme inducers and inhibitors) change both binding and metabolism in ways the calculator does not model.
- The loading dose formula assumes a normal volume of distribution; critical illness, obesity and the elderly deviate from it.
- The calculator assumes a steady-state trough level; levels drawn mid-interval or during acute illness need clinical interpretation.
Frequently asked questions
What is the Sheiner-Tozer equation for phenytoin?
The Sheiner-Tozer equation corrects a measured total phenytoin level for low albumin: adjusted level = measured level divided by (0.2 x albumin in g/dL + 0.1) in normal renal function, or divided by (0.1 x albumin + 0.1) in end-stage renal disease. For example, a measured level of 12 mg/L with albumin 2.5 g/dL corrects to 20 mg/L, which is therapeutic, not subtherapeutic.
What is the therapeutic range for phenytoin?
The usual therapeutic range for total phenytoin is 10 to 20 mg/L (40 to 80 micromol/L), and 1 to 2 mg/L for free phenytoin. Levels above 20 mg/L risk nystagmus, above 30 mg/L ataxia, and above 40 mg/L depressed consciousness. The range is a guide: some patients are controlled below 10 and some show toxicity within the range.
Why does kidney failure change the phenytoin correction?
In end-stage renal disease, uraemic toxins displace phenytoin from albumin, so the free fraction rises more than albumin alone would predict. The Sheiner-Tozer equation uses a smaller albumin coefficient (0.1 instead of 0.2) for these patients. A measured level of 8 mg/L with albumin 2.0 g/dL in ESRD corrects to about 26.7 mg/L, which is toxic, even though the measured number looks low.
How do you adjust a phenytoin dose from a measured level?
The bedside estimate is proportional: new daily dose = current daily dose x (target level / measured level). Because phenytoin follows saturable Michaelis-Menten kinetics, small dose increases can produce disproportionately large level rises, so increases above 20 percent should be made cautiously and the level rechecked at steady state, about 5 to 7 days after a change in most patients.
When should free phenytoin be measured instead of total?
Measure free phenytoin directly when the correction is unreliable: end-stage renal disease, hypoalbuminaemia combined with interacting drugs (especially valproate, which both displaces phenytoin and inhibits its metabolism), pregnancy, critical illness, and when the patient is toxic despite a therapeutic total level or controlled despite a subtherapeutic one.
What is the phenytoin loading dose formula?
The loading dose in mg is (target level minus current level) x 0.65 L/kg x body weight in kg, where 0.65 L/kg is the typical volume of distribution of phenytoin. For example, to reach 15 mg/L from 5 mg/L in a 70 kg patient: (15 - 5) x 0.65 x 70 = 455 mg. Intravenous loading is usually given as fosphenytoin in phenytoin equivalents (PE) for safer administration.
Related adult dosing calculators
Sources: Sheiner LB, Tozer TN. Clinical pharmacokinetics: concepts and applications. Clin Pharmacokinet. 1978;3(6):288-301. Therapeutic range, toxicity signs and loading-dose pharmacokinetics follow standard clinical pharmacokinetics references.