Mid-Parental Height Calculator
Predict your child's likely adult height from both parents' heights, with the healthy target range and a plain-English interpretation.
Use this mid-parental height calculator to predict your child's likely adult height from the heights of both biological parents. It uses the Tanner method, the standard approach paediatric endocrinologists have used for more than fifty years: average the parents' heights, adjust for the child's sex, and allow a healthy range of 8.5 cm on either side of the result. You only need the two parental heights and the child's sex. If you also enter your child's current age and height, the calculator gives a rough read on where they sit relative to the adult target range, with the important caveats explained below.
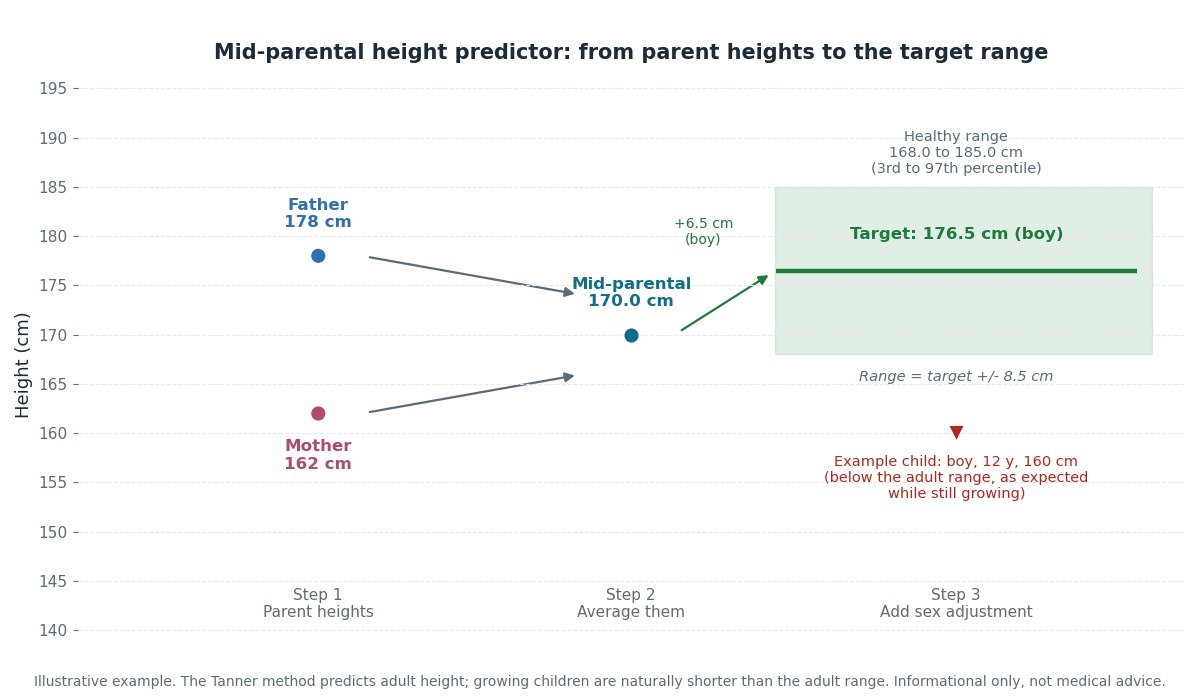
How the mid-parental height calculator works
The method behind this calculator was first described by the British growth researchers Tanner, Goldstein and Whitehouse in 1970, and it is still the standard starting point in paediatric endocrinology clinics today. It runs in three short steps. First, the heights of both biological parents are averaged to give the mid-parental height. Second, that average is adjusted for the child's sex: 13 cm is the long observed average difference between adult male and female stature, so half of it, 6.5 cm, is added for a boy and subtracted for a girl. Third, a healthy range is drawn around the result: 8.5 cm on either side, which Tanner estimated from theoretical considerations to cover roughly the 3rd to 97th percentiles of expected adult height.
In formula form, with heights in centimetres:
- Boy: target height = (father's height + mother's height + 13) / 2
- Girl: target height = (father's height + mother's height − 13) / 2
- Healthy range: target height − 8.5 cm to target height + 8.5 cm
A worked example makes it concrete. Take a father who is 178 cm and a mother who is 162 cm. The mid-parental height is (178 + 162) / 2 = 170.0 cm. For their son, add 6.5 cm to reach a target of 176.5 cm, with a healthy range of 168.0 to 185.0 cm. For their daughter, subtract 6.5 cm to reach a target of 163.5 cm, with a healthy range of 155.0 to 172.0 cm.
| Family | Mid-parental height | Boy target (range) | Girl target (range) |
|---|---|---|---|
| Father 178 cm, mother 162 cm | 170.0 cm | 176.5 cm (168.0 to 185.0) | 163.5 cm (155.0 to 172.0) |
| Father 180 cm, mother 165 cm | 172.5 cm | 179.0 cm (170.5 to 187.5) | 166.0 cm (157.5 to 174.5) |
| Father 175 cm, mother 160 cm | 167.5 cm | 174.0 cm (165.5 to 182.5) | 161.0 cm (152.5 to 169.5) |
Notice how the range is wide: 17 cm from bottom to top. That width is honest. Adult height is influenced by hundreds of genetic variants plus nutrition, health, sleep and timing of puberty, so two parents' heights can only narrow the prediction so far. A review of the method published in 2024 in the journal Children found that standard mid-parental height explained about 36 percent of the variation in children's final heights across 23 large families, and that children averaged 2.7 cm taller than the formula predicted. The gap came largely from parents having shrunk with age by the time they were measured, a reminder that the formula works best when parental heights are measured carefully and recently.
What the target range of plus or minus 8.5 cm means
The target height is the centre of the prediction, but the range is where the clinical value lies. Tanner's original estimate held that a child's final adult height should fall within 8.5 cm of the target in either direction, corresponding roughly to the 3rd and 97th percentiles. In plain terms, about 94 out of 100 healthy children are expected to land inside the band, and a handful will land outside it while being perfectly healthy.
Later researchers proposed slightly wider bands: plus or minus 9 cm for girls and plus or minus 10 cm for boys, as summarised in the 2024 Children review. Others suggested using 1.64 standard deviations, which translates to about 10.6 cm for girls and 11.7 cm on the CDC growth charts. This calculator uses Tanner's classic 8.5 cm, the figure most clinics still quote, because it keeps the prediction comparable with what a paediatrician will calculate. The key point is the same under any of these bands: falling just outside the range is a reason for a check, not a diagnosis.
It also helps to know what the range is not. It is not a promise, and it is not a grade. A child who ends up at the bottom of the range has not failed anything, and a child at the top has not won anything. Height within the family range is simply one piece of evidence, alongside growth velocity and puberty timing, that growth is proceeding as the genes intended.
Using the target height alongside your child's growth
The target height becomes most useful when it is compared with how your child is actually growing, and here a subtle point matters. Clinicians do not compare a child's current height directly with the adult target range, because a growing child is obviously shorter than any adult prediction. Instead they estimate the child's projected adult height: they plot the child's current height on a growth chart, note which centile line the child is following, and extend that centile to adult age. That projected height is then compared with the target range from this calculator.
This is why steady tracking beats single measurements. A child who has always followed the 25th centile and whose projected height sits inside the target range is usually showing healthy familial short stature, a normal variant, even though the child is short compared with classmates. A child whose projected height falls more than 8.5 cm below the target range, or who is drifting down across centile lines, deserves a closer look. Our height-for-age centile calculator can place a current measurement on its centile, and the height velocity calculator checks whether the yearly growth rate is normal, which is often more informative than height alone.
Puberty timing adds another layer. A child who enters puberty late will look short beside early maturing peers for a few years and then catch up, a pattern called constitutional delay of growth and puberty. Bone age assessment helps here: if the skeleton is younger than the calendar age, there is more growing time left than the birthday suggests. Our bone age calculator explains how clinicians read that delay. None of these patterns can be sorted out from a single height, which is why the position check on this page is deliberately labelled rough.
What the target height cannot tell you
Every prediction method has blind spots, and an honest calculator should name them. First, the formula ignores regression to the mean: very tall parents tend to have children somewhat shorter than the mid-parental prediction, and very short parents tend to have children somewhat taller. This pattern, first described by Galton in the 19th century, means the formula is least accurate at the extremes, exactly where families are most anxious.
Second, the 13 cm sex difference is an average, not a law. It was derived from mid 20th century British data, and the true average gap between adult men and women varies between populations and has shifted with the secular trend in height over the past century. In some populations the real gap is closer to 11 cm, in others nearer 14 cm, so the adjustment is approximate everywhere outside the population it was measured in.
Third, the method assumes both parents' measured heights. People routinely overstate their own height by a centimetre or two, and older parents have genuinely shrunk: height loss typically begins around age 30 and accelerates later, so a father measured at 60 is shorter than he was at 25 when his genes were, so to speak, recorded. The 2024 review found this shrinkage explained most of the 2.7 cm shortfall in predictions. For the best estimate, measure both parents with a stadiometer or against a wall, shoes off, rather than relying on remembered figures.
Fourth, the formula knows nothing about tempo. Two children with identical parents can differ by several centimetres in final height because one had an early puberty and one a late one, because of differences in nutrition or chronic illness, or because of the ordinary genetic lottery among siblings. The target range captures some of this uncertainty, but siblings still scatter around the target rather than landing on it.
Finally, the method only applies to biological parents. For adopted children, or where donor conception means a biological parent's height is unknown, the target height cannot be calculated and growth must be judged against population centiles alone.
When to talk to a paediatrician
Use the target range as a prompt, not a verdict, and seek clinical advice if any of the following apply. Take your child to the paediatrician if their projected adult height, estimated from growth chart tracking, falls clearly outside the target range on either side. Go sooner if your child is crossing centile lines downward over successive measurements, if growth seems to have stalled for more than six to twelve months, or if height is below the 3rd centile with no family pattern to explain it.
Puberty timing matters too: no signs of puberty by 14 in boys or 13 in girls, or puberty that starts but then stalls, warrants assessment, as does puberty that begins unusually early. Other flags include chronic symptoms alongside slow growth, such as tummy pain, diarrhoea, excessive thirst, fatigue or headaches, and any suspicion of an underlying condition affecting the spine, limbs or proportions. A single low reading should always be confirmed with a careful remeasurement before anyone worries, because measurement error is one of the commonest causes of a scary number.
What the paediatrician will do is reassuringly systematic: confirm the measurements, plot the full growth history, calculate the target height exactly as this page does, check growth velocity, examine puberty stage, and order a bone age X-ray or blood tests only if the pattern suggests it. Most referrals for short stature end with the diagnosis of familial short stature or constitutional delay, both normal variants that need no treatment, only monitoring.
Measuring height accurately at home
The formula is only as good as its inputs, and home measurements are easy to get slightly wrong. Measure in the morning if you can, since the spine compresses by up to a centimetre over the day. The person stands barefoot with heels, buttocks, shoulder blades and the back of the head touching the wall, feet together, looking straight ahead so the ear canal and the bottom of the eye socket form a horizontal line. Place a flat object such as a hardback book firmly on the crown of the head, mark the wall at its underside, and measure from the floor to the mark with a tape.
Avoid the common errors: measuring on carpet, which steals up to a centimetre; letting the child stand on tiptoes or slouch; measuring with shoes or a hairstyle that adds height; and rounding up. Record to the nearest millimetre and repeat twice. For children under two, length is measured lying down with a length board, and standing height runs about 0.7 cm shorter than lying length, so do not mix the two methods in one record. If your home measurements and the clinic's disagree, trust the clinic's stadiometer.
Frequently asked questions
How accurate is the mid-parental height method?
It is a rough estimate. In a large family study reviewed in 2024, standard mid-parental height explained about 36 percent of the variation in children's final heights, and children averaged 2.7 cm taller than predicted, partly because parents shrink with age. Treat it as a starting point for discussion with your paediatrician, not a fixed destiny.
Why does the formula add or subtract 13 cm?
The 13 cm represents the average difference in adult stature between men and women in the populations where the method was developed. For a boy you add 13 cm to the mother's height before averaging with the father's; for a girl you subtract 13 cm from the father's height before averaging with the mother's. The true gap varies between populations, which is one reason the prediction stays approximate.
What does the target range of plus or minus 8.5 cm mean?
Tanner estimated that a child's final adult height should fall within 8.5 cm above or below the target, roughly the 3rd to 97th percentiles. If a child's projected adult height sits inside that band, growth is considered consistent with the family pattern; outside it, further assessment is usually advised.
My child's current height is below the target range. Should I worry?
Not on that fact alone. Growing children are naturally shorter than adult target values, so a direct comparison of current height with the adult range is only a rough flag. What matters clinically is the projected adult height from growth chart tracking. If growth has slowed, centiles are being crossed downward, or puberty timing looks unusual, see your paediatrician.
Can I use this calculator before my child is born?
Yes. The method needs only the heights of both biological parents and the child's sex, so it works during pregnancy or any time after. Many parents use it out of curiosity, and paediatricians use it later as a reference when they assess a child's growth.
Does the method work for adopted children or donor conception?
No. It reflects inherited growth potential from the biological parents. Where a biological parent's height is unknown, the target height cannot be calculated, and growth is assessed against population centile charts instead.
Related calculators
- Child Development calculators hub
- Predicted Adult Height (Bayley-Pinneau): projects adult height from current height and bone age
- Height-for-Age Centile: place a current measurement on its growth centile
- Bone Age Calculator: understand skeletal versus calendar age
- Height Velocity Calculator: check whether yearly growth is on track
References
- Zeevi D, Ben Yehuda A, Nathan D, Zangen D, Kruglyak L. Accurate Prediction of Children's Target Height from Their Mid-Parental Height. Children. 2024;11(8):916. doi:10.3390/children11080916 (verified 2026-10-02; confirms the ±8.5 cm range as Tanner's estimate for the 3rd to 97th percentiles, and the later ±9 cm / ±10 cm proposals).
- Tanner JM, Goldstein H, Whitehouse RH. Standards for children's height at ages 2 to 9 years allowing for heights of parents. Arch Dis Child. 1970;45(244):755-762. Origin of the mid-parental target height method and the 8.5 cm range, as described in the 2024 review above.