GRACE Score Calculator
This GRACE score calculator estimates mortality in acute coronary syndrome from eight variables recorded at presentation. It computes both the in-hospital (Granger) nomogram score and the admission-to-6-month (Fox) nomogram score, then maps each to mortality using the official GRACE score-to-probability tables. Enter the eight variables below.
What your GRACE score calculator result means
The calculator reports two scores and two mortality estimates, because the official GRACE system contains two published nomograms that answer two different questions. The in-hospital score (Granger nomogram, 2003) estimates the probability of dying before hospital discharge. The admission-to-6-month score (Fox nomogram, 2006) estimates the cumulative probability of death from admission through six months. Both use the same eight variables, but they assign slightly different points to each, so the two scores for one patient are close but not identical.
For the in-hospital score, the bands used in European and American guidelines are:
| In-hospital GRACE score | Risk band | Typical in-hospital mortality |
|---|---|---|
| 108 or below | Low | About 1 percent or less |
| 109 to 140 | Intermediate | About 1 to 3 percent |
| Above 140 | High | Above 3 percent |
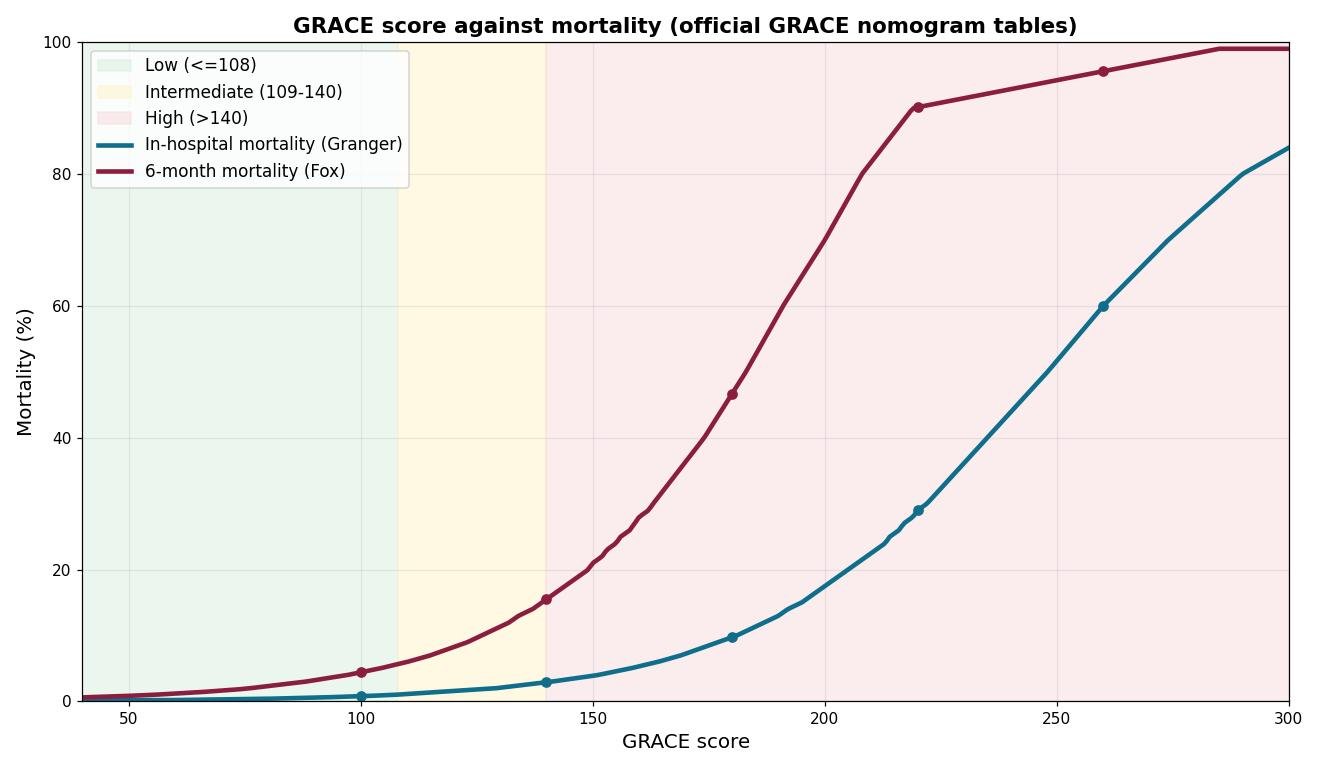
These band edges come from the official GRACE tables: a score of 129 maps to 2 percent, 141 maps to 3 percent, and the curve rises steeply after 200, reaching 50 percent at a score of 248. For the 6-month score, UK guidance (NICE NG185) uses mortality bands instead of score bands: above 9 percent is highest risk, above 6 percent high risk, above 3 percent intermediate risk, above 1.5 percent low risk, and 1.5 percent or below is lowest risk.
How the GRACE score is calculated
Each of the eight variables is converted to points using the official GRACE nomograms, which interpolate linearly within each band rather than using coarse steps. Age contributes the most points: from 0 below age 30 up to 100 at age 90 and above on the in-hospital nomogram. Systolic blood pressure works in reverse, with low pressures scoring up to 58 points and pressures above 200 scoring nothing, because hypotension at presentation signals a failing circulation. Heart rate, creatinine, and the Killip class add points in the same graduated way, and the three binary factors add fixed points: 39 for cardiac arrest at admission, 28 for ST-segment deviation, and 14 for elevated cardiac markers on the in-hospital nomogram.
The points are summed to give the GRACE score, which is then looked up in the official score-to-probability table. A score of 100 maps to about 0.8 percent in-hospital mortality, 140 to about 2.9 percent, 180 to about 9.9 percent, and 220 to about 29 percent. The calculator performs this lookup by interpolating between the published table rows, which is how the official GRACE software handles scores that fall between the printed values.
In-hospital score versus 6-month score
The two nomograms differ in more than their time horizon. The in-hospital (Granger) nomogram weights acute instability heavily: cardiac arrest contributes 39 points and Killip class IV contributes 59. The 6-month (Fox) nomogram re-weights the same variables for longer-term risk: cardiac arrest contributes 30 points and Killip class IV contributes 44, while the age and blood pressure bands are reshaped. In practice the two scores usually agree on the risk band, but the 6-month mortality estimate is always higher, because it counts deaths over a longer period.
Which one should you use? For the immediate decision in the emergency department or on admission, the in-hospital score and its 140 cutoff drive the timing of angiography. For counselling and discharge planning, the 6-month score gives the fuller picture of what the patient faces after leaving hospital.
GRACE 1.0 and GRACE 2.0
The original GRACE score (sometimes called GRACE 1.0) was published in two parts: the in-hospital model by Granger and colleagues in 2003 and the admission-to-6-month model by Fox and colleagues in 2006. GRACE 2.0, described in 2014, kept the same eight input variables but rebuilt the underlying statistical models on newer registry data, improving discrimination and adding 1-year and 3-year mortality estimates. The point tables and mortality lookups in this GRACE score calculator are the official nomograms maintained by the GRACE coordinating centre at the University of Massachusetts Medical School, which underpin both versions.
What the score changes in practice
The GRACE score is one of the few risk scores that guidelines use to set the timing of treatment. In non-ST-elevation acute coronary syndrome, a GRACE score above 140 identifies patients who benefit from coronary angiography within 24 hours, a recommendation carried in both European and American guidelines and supported by the TIMACS trial subgroup analysis. Scores of 140 or below support a less urgent, selective invasive strategy. The score also helps weigh bleeding risk against ischaemic risk when choosing antithrombotic therapy, for example in the fondaparinux versus heparin decision studied in OASIS-6. A very high score should prompt senior cardiology review, intensive monitoring, and early discussion of goals of care in frail patients.
Limitations of this GRACE score calculator
The GRACE score was derived from registry patients aged 18 and over presenting with acute coronary syndrome, and its mortality estimates apply to that population. It does not apply to stable coronary disease, to patients without ACS, or to risk prediction in the general population. The score uses only admission variables, so it cannot reflect complications that develop during the hospital stay. The mortality tables are population averages: an individual patient's risk may be higher or lower depending on factors the score does not capture, such as frailty, renal replacement therapy, or the timeliness of revascularisation. Finally, the nomogram lookup is an approximation of the underlying logistic models; the coordinating centre notes that probabilities computed directly from the model equations are slightly more accurate than those from the integer score.
Frequently asked questions
What is the GRACE score used for?
The GRACE score estimates the risk of death in patients presenting with acute coronary syndrome (STEMI, NSTEMI, or unstable angina). It produces two estimates: in-hospital mortality from the Granger nomogram and admission-to-6-month mortality from the Fox nomogram. Clinicians use it to decide how urgently a patient needs an invasive strategy such as coronary angiography.
What GRACE score is considered high risk?
For the in-hospital GRACE score, 140 or below is low to intermediate risk and above 140 is high risk. A score above 140 corresponds to more than 3 percent in-hospital mortality in the official GRACE tables, and guidelines use this cutoff to recommend an early invasive strategy within 24 hours.
How is the GRACE score calculated?
Eight variables collected at presentation are each assigned points: age, heart rate, systolic blood pressure, serum creatinine, Killip class, cardiac arrest at admission, ST-segment deviation, and elevated cardiac markers. Points are interpolated within the official GRACE nomogram bands and summed. The total is then mapped to mortality using the official GRACE score-to-probability tables.
What is the difference between GRACE 1.0 and GRACE 2.0?
GRACE 1.0 used the original nomograms published in 2003 and 2006. GRACE 2.0, described in 2014, kept the same eight input variables but refined the underlying statistical models, giving better discrimination and more accurate mortality estimates, including 1-year and 3-year probabilities. The point tables in this calculator are the official nomograms maintained by the GRACE coordinating centre.
Can the GRACE score be used for patients who are not in hospital?
No. The GRACE score was derived from patients presenting to hospital with acute coronary syndrome, and its mortality estimates apply to that setting. It should not be used as a general cardiovascular risk score, for stable angina, or for post-discharge follow-up without clinical judgement, because the input variables and the derivation population do not match.
Why do my in-hospital and 6-month GRACE scores differ?
They come from two different published nomograms. The in-hospital score uses the Granger nomogram (2003) and the 6-month score uses the Fox nomogram (2006), which assign slightly different points to the same variables, for example 59 versus 44 points for Killip class IV. Both are reported by the official GRACE calculator, and each has its own mortality mapping.
Related cardiology calculators
Sources: Granger CB et al. Predictors of hospital mortality in the global registry of acute coronary events. Arch Intern Med. 2003;163(19):2345-2353 (in-hospital model and nomogram). Fox KAA et al. Prediction of risk of death and myocardial infarction in the six months after presentation with acute coronary syndrome. BMJ. 2006;333(7578):1091 (admission-to-6-month nomogram). Fox KAA et al. Prediction of risk of death and myocardial infarction in the six months after presentation with acute coronary syndrome (GRACE 2.0). Heart. 2014;100(14):1097-1103. NICE NG185: Acute coronary syndromes (six-month mortality risk bands). Point tables and score-to-probability lookups: GRACE Risk Model Coefficients, Center for Outcomes Research, University of Massachusetts Medical School (updated January 2014).